Chapter 3: Periodic Table & Periodicity — The Map of the Elements
The Periodic Table is one of the most powerful tools in science—a beautifully organized map that reveals patterns, predicts behavior, and unlocks the secrets of matter. It is not just a chart; it is a story of order emerging from complexity.
3.1 The Birth of the Periodic Table
The modern periodic table is credited to Dmitri Mendeleev (1869), who arranged elements based on increasing atomic mass and noticed repeating patterns in their properties.
Later, Henry Moseley refined this by arranging elements according to atomic number, giving us the modern periodic law:
“The properties of elements are periodic functions of their atomic numbers.”
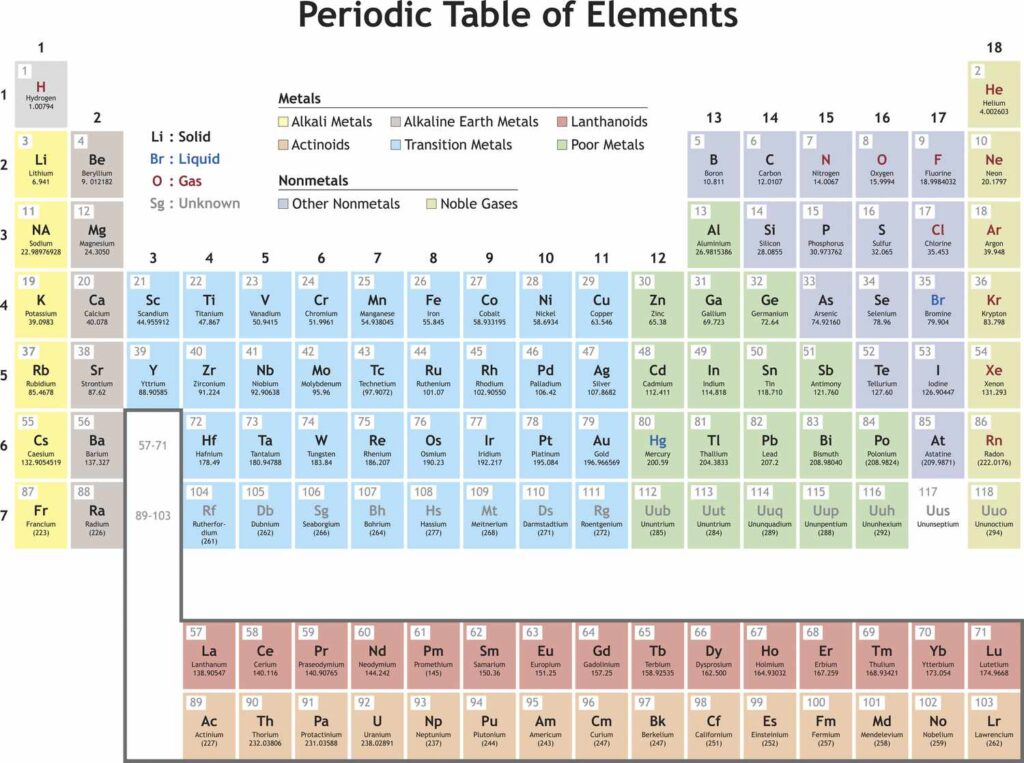
3.2 Structure of the Periodic Table
The periodic table is arranged into rows (periods) and columns (groups).
Basic Layout
Key Sections
- Groups (Vertical): Elements with similar chemical properties
- Periods (Horizontal): Elements with increasing atomic number
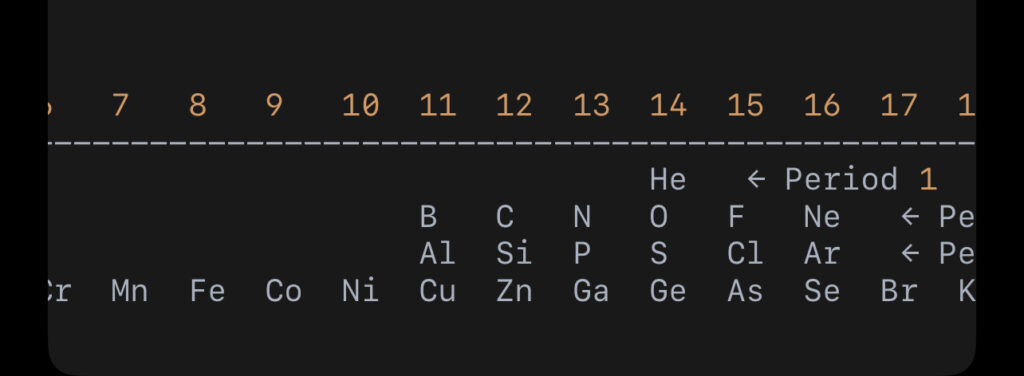
3.3 Blocks of the Periodic Table
The table is divided into blocks based on electron configuration:

- s-block: Groups 1–2 (alkali & alkaline earth metals)
- p-block: Groups 13–18 (includes nonmetals & noble gases)
- d-block: Transition metals
- f-block: Lanthanides & actinides (placed below)
3.4 Classification of Elements
Metals, Nonmetals, and Metalloids

- Metals: Conduct heat/electricity, malleable (e.g., Fe, Cu)
- Nonmetals: Poor conductors (e.g., O, N, Cl)
- Metalloids: Intermediate properties (e.g., Si, Ge)
3.5 Periodic Trends (Periodicity)
As you move across or down the periodic table, certain properties show predictable patterns—this is called periodicity.
1. Atomic Radius (Size of Atoms)
Trend:
- Decreases across a period →
- Increases down a group ↓
Diagram
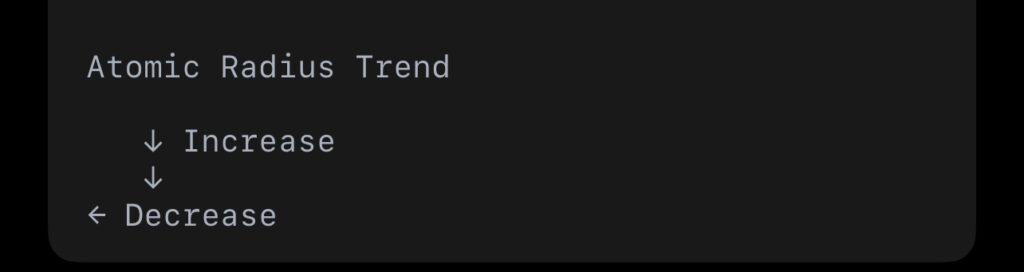
Explanation:
Across a period, nuclear charge increases, pulling electrons closer. Down a group, more shells are added, increasing size.
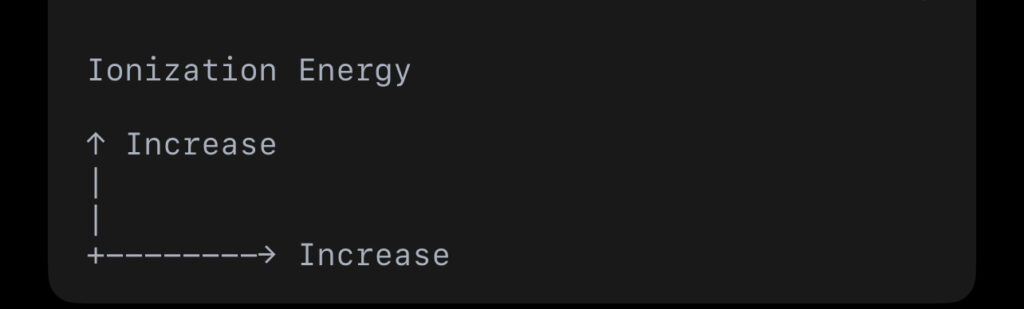
2. Ionization Energy (Energy to Remove Electron)
Trend:
- Increases across →
- Decreases down ↓
Diagram
3. Electronegativity (Attraction for Electrons)
Trend:
- Increases across →
- Decreases down ↓
Fluorine is the most electronegative element.
4. Metallic Character
Trend:
- Decreases across →
- Increases down ↓
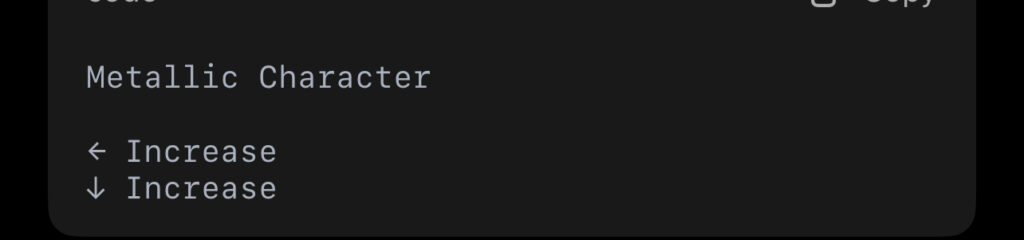
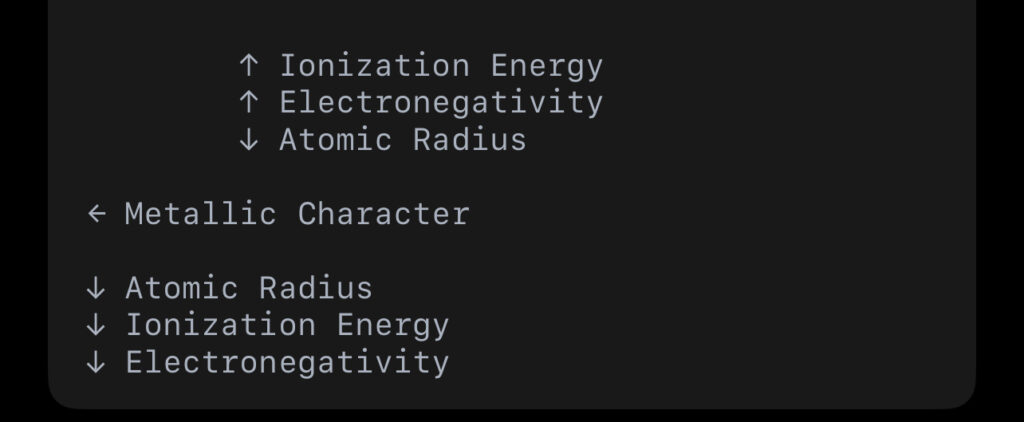
3.6 Visual Summary of Trends
3.7 Special Groups in the Periodic Table
- Group 1: Alkali metals (very reactive)
- Group 2: Alkaline earth metals
- Group 17: Halogens (reactive nonmetals)
- Group 18: Noble gases (inert, stable)
3.8 Why Periodicity Matters
Periodicity helps scientists:
- Predict chemical reactions
- Understand bonding behavior
- Design new materials
- Develop medicines and technologies
It transforms the periodic table from a chart into a predictive tool.
3.9 Real-Life Connection
- Why sodium reacts violently with water? → Position in Group 1
- Why noble gases don’t react? → Full electron shells
- Why metals conduct electricity? → Free-moving electrons
All these answers come from periodic trends.
Chapter Summary
The periodic table organizes elements based on atomic number and reveals repeating patterns in their properties. These patterns—atomic radius, ionization energy, electronegativity, and metallic character—allow us to predict how elements behave.
Closing Insight
The periodic table is like a cosmic codebook. Once you learn how to read it, you can predict the behavior of elements you’ve never even seen. It turns chemistry from memorization into understanding.